.svg)


Beedeez Analytics: data at the service of your training strategy
.webp)
What is Beedeez Analytics?

A clear vision
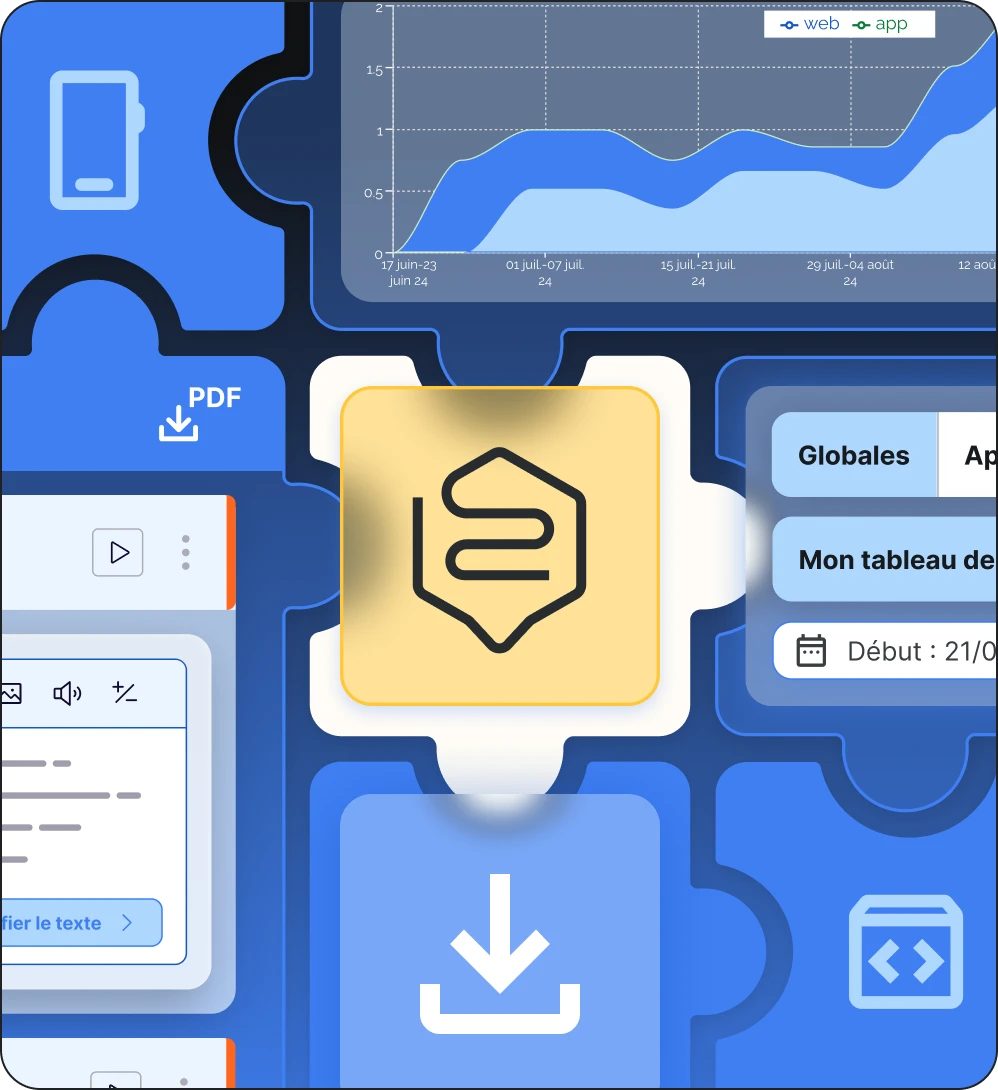
Dashboards that allow you to monitor all training activity at a glance.
Indicators that matter
Actionable data: everything that makes a difference, from global to retail.
An asset to your strategic management
Show your impact, adjust your plans, and align your training and business without getting bogged down in endless spreadsheets.
A great initiative doesn’t just work: it shows it, with data.

Scattered, hard-to-use data
- Siloed information spread across different systems and formats
- Too much time spent manually collecting and processing data
- Difficulty obtaining a consolidated, coherent view of training activity

A lack of visibility into real impact
- Limited traditional metrics (training hours, attendance...)
- Difficulty measuring actual skill transfer on the job
- No clear link between training efforts and business performance
.webp)
Rising expectations from leadership
- Growing pressure to demonstrate the ROI of training investments
- Demand for strategic reporting to inform executive decisions
- Need to continuously optimize training budgets and resources
Our mission
To transform training measurement into a genuine strategic lever, allowing L&D teams to effectively manage their actions and demonstrate their added value.
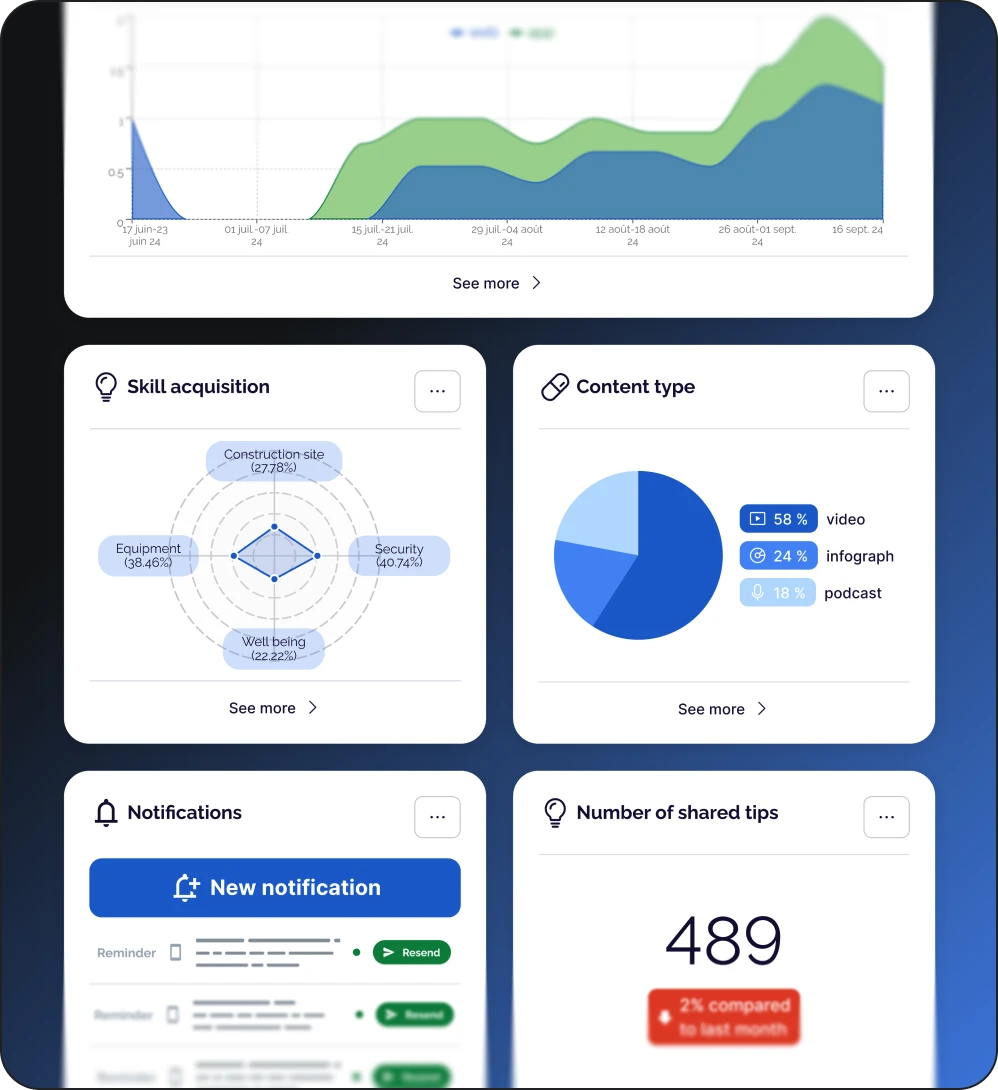
Customizable and intuitive dashboards
A global, customizable view
Unlimited number of dashboards
Create and switch between several dashboards according to your needs
Intuitive navigation
Seamlessly transition from the big picture to the most granular details
Structured organization
Six types of specialized widgets: tips, content, track, capsules, learners, coaching, and curriculum
Memorize configurations
Save your custom dashboards
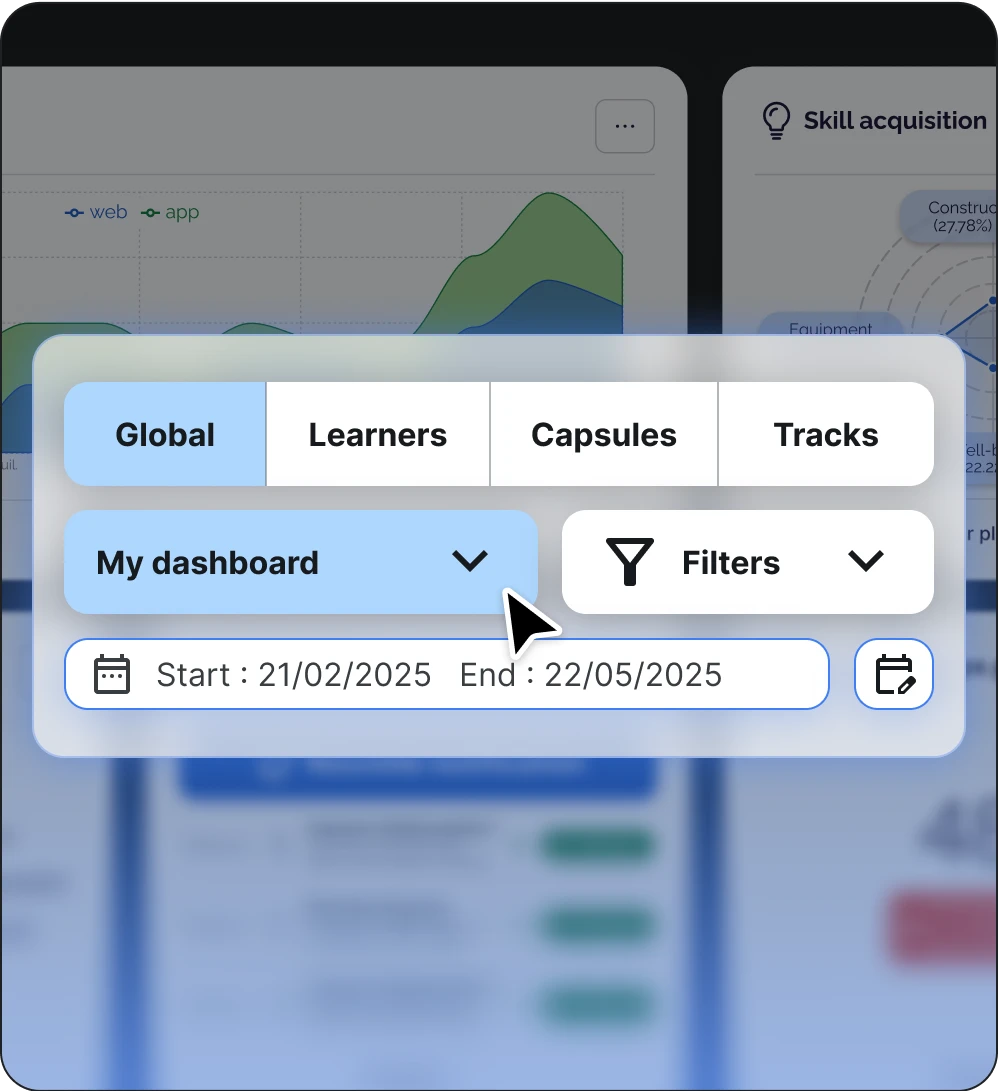
Dynamic multi-criteria filtering
List of interchangeable filters
Fast switching between different filtered views
By organizational structure
Analysis by department, BU, region, entity...
By period
Flexible time comparisons (rolling periods, custom periods)
By user group
Fine segmentation of populations
By user status
Inclusion or exclusion of deactivated users
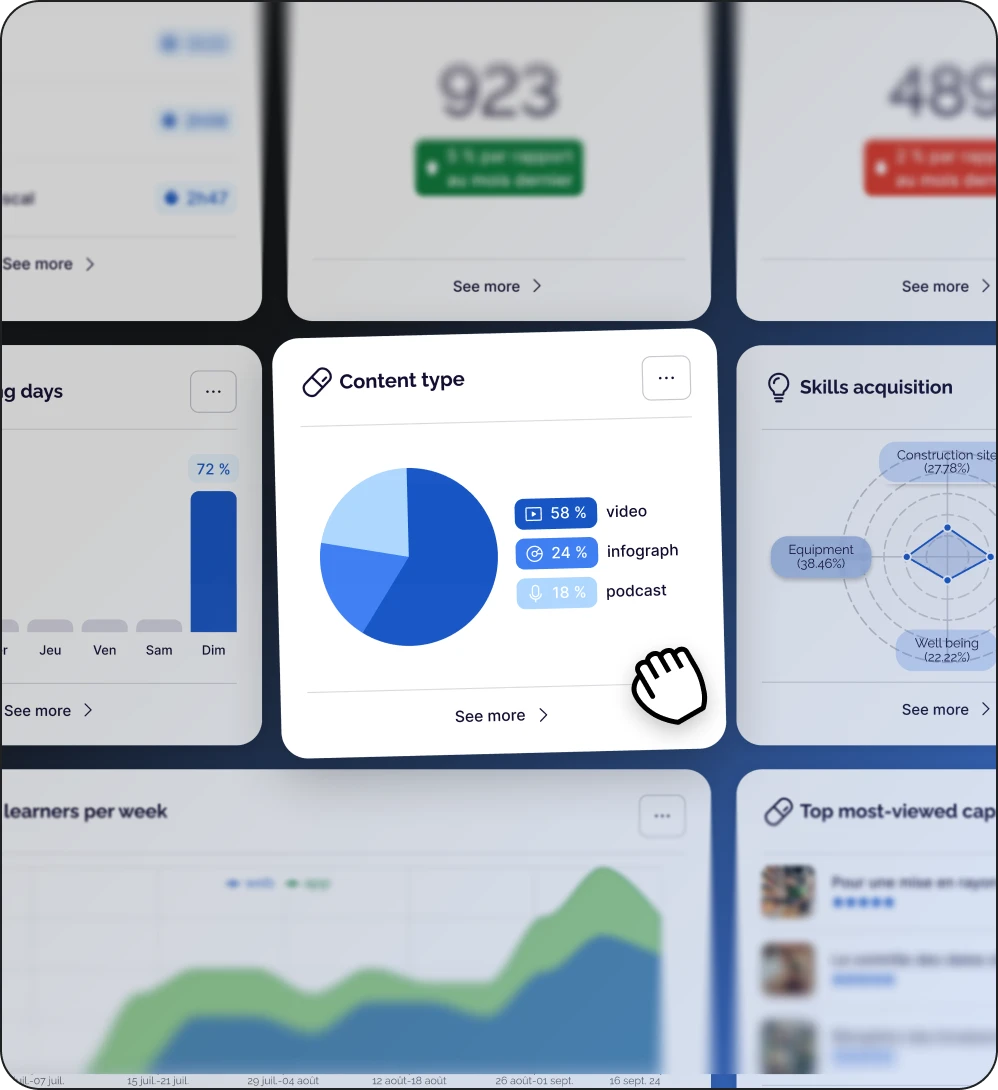
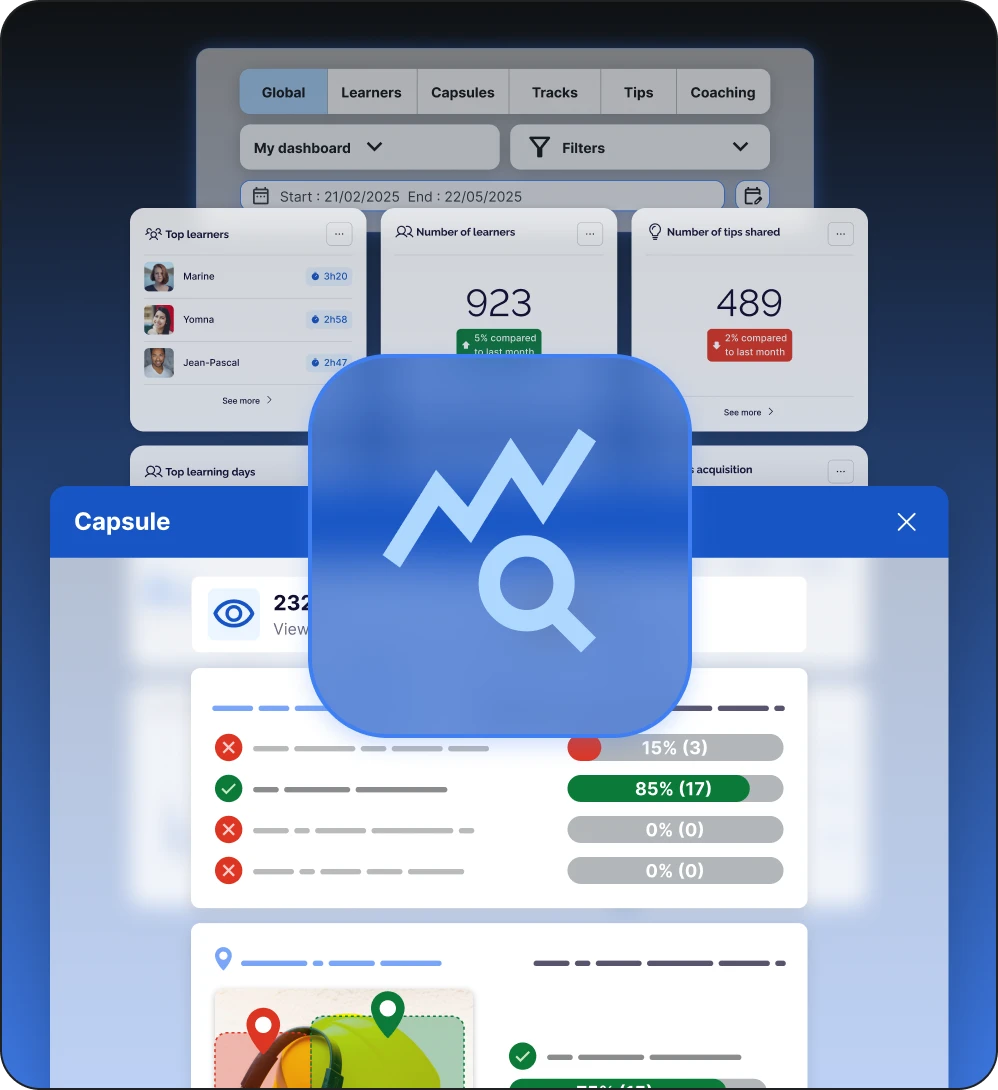
Advanced widgets
Widget library
Over 100 ready-to-use indicators
Individual configuration
Precise configuration of each widget
Data transparency
Each widget is accompanied by a clear notice on the nature of its data
Strategic indicators for management
Impact measurement and ROI
Apprenticeship days
Precise quantification of the time invested in training
Activity rate
Percentage of learners actively engaged by time period
Skills progression
Measurable evolution of knowledge and know-how
Internal benchmarks
Comparison of performance between departments, regions or entities
Decision dashboards
Consolidated KPIs
Summary view of strategic indicators
Trends and developments
Visualization of progress and areas for improvement
Automated reports
Generating summary documents for committees
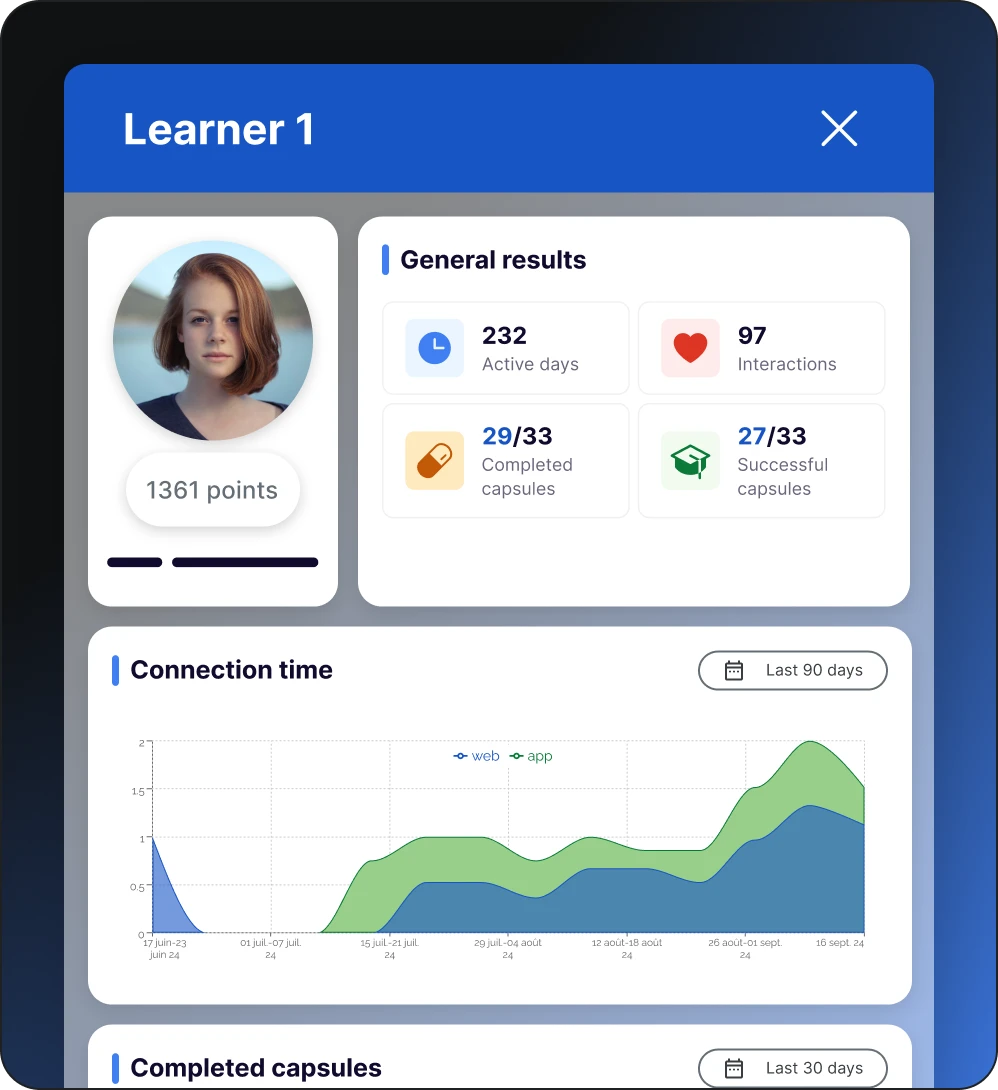
Operational metrics for training teams
Detailed content tracking
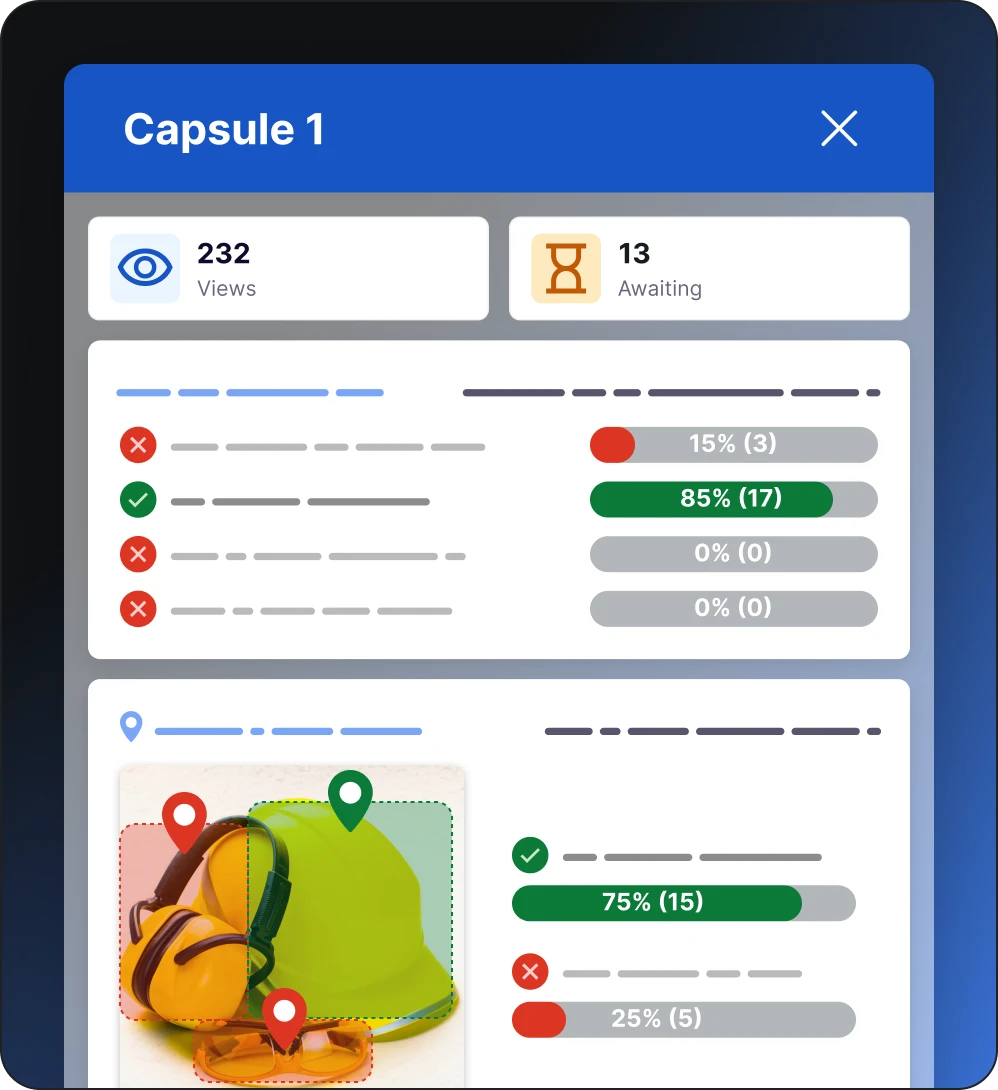
Capsule analysis
Over 20 granular indicators by content (completion rate, time spent, average score, etc.)
Performance by activity
Precise measurement of the effectiveness of each instructional element
Comparison of formats
Identify the most effective types of content
Course management
Penetration rate
Ratio between access, startup and completion
Sequential analysis
Identifying critical steps or dropouts
Average travel time
Measuring program efficiency
Commitment Management
Activity by period
Monitoring learning rhythms
Impact of notifications
Measuring the extent and effectiveness of notifications and reminders
Social contributions
Analysis of interactions and sharing of tips
Data that can be used daily
Specialized reports by category
Tabbed browsing
Direct access to dedicated sections (capsules, tips, tracks, coaching, and curriculum)
Global and detailed views
First, a general table, then an in-depth line-by-line exploration
Detailed stats
Fine analysis by element (e.g., per capsule)
Deep data exploration
Intuitive drill-down
Access to the specific details of each item
Advanced statistics per capsule
Rankings, detailed answers, graphical visualizations
Fast isolation
Instant focus on a specific department or group
Contextualization of performances
Periodic comparisons and variance analyses
Formats adapted to each need
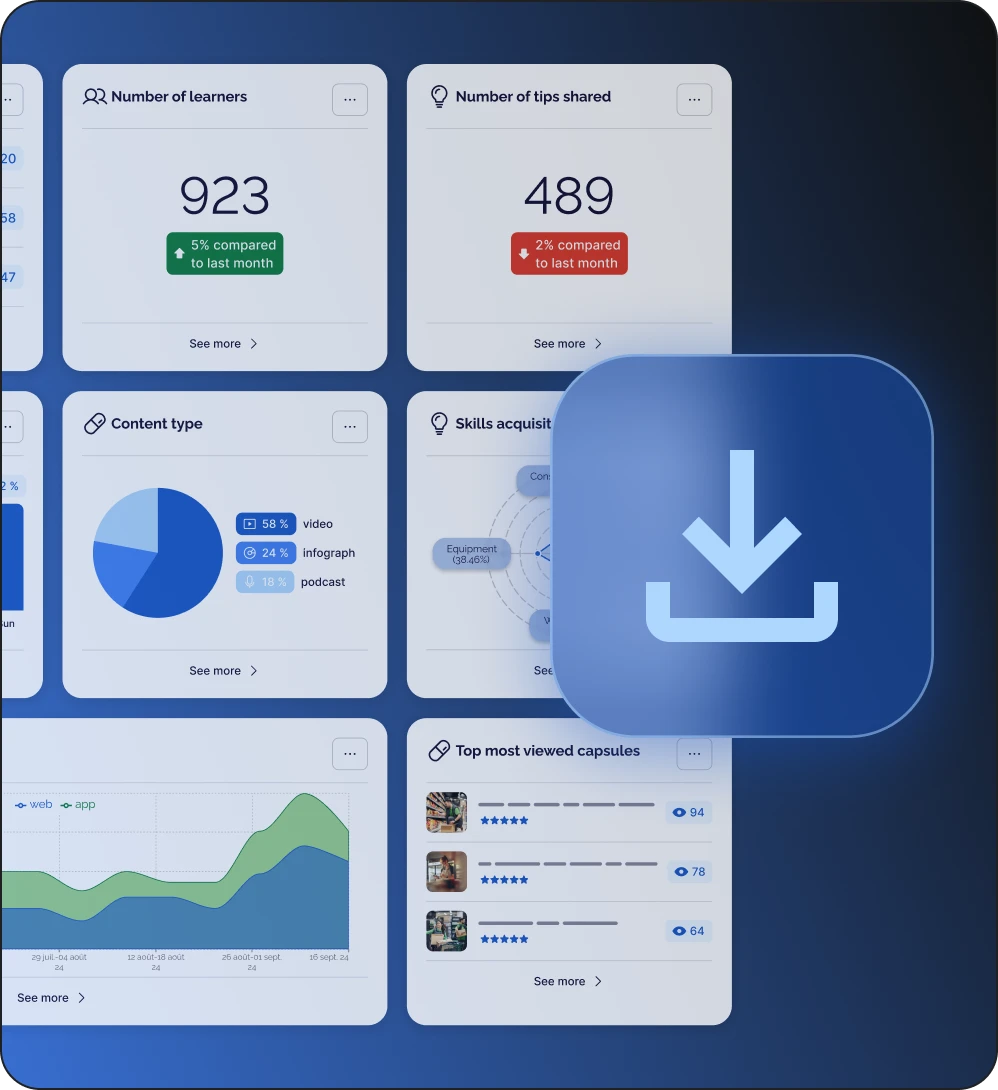
Export widget by widget
Targeted extraction in PDF or Excel
Global export
Complete data in Excel format for advanced analyses
Advanced multi-type export
Generation of ZIP archives combining different data formats
Consolidated reports
Formatted documents ready to be presented
Analytics at the heart of your learning strategy
Continuous improvement cycle
Precise diagnosis
Identify strengths and areas for improvement
Measured experimentation
Quantified evaluation of new approaches
Guided optimization
Adjustments based on objective data
Informed decision making
Optimal allocation of resources
Focus on high-impact initiatives
Customizing approaches
Adaptation of strategies according to the specific needs of populations
Anticipation of needs
Early identification of emerging trends
A unified vision of your training strategy
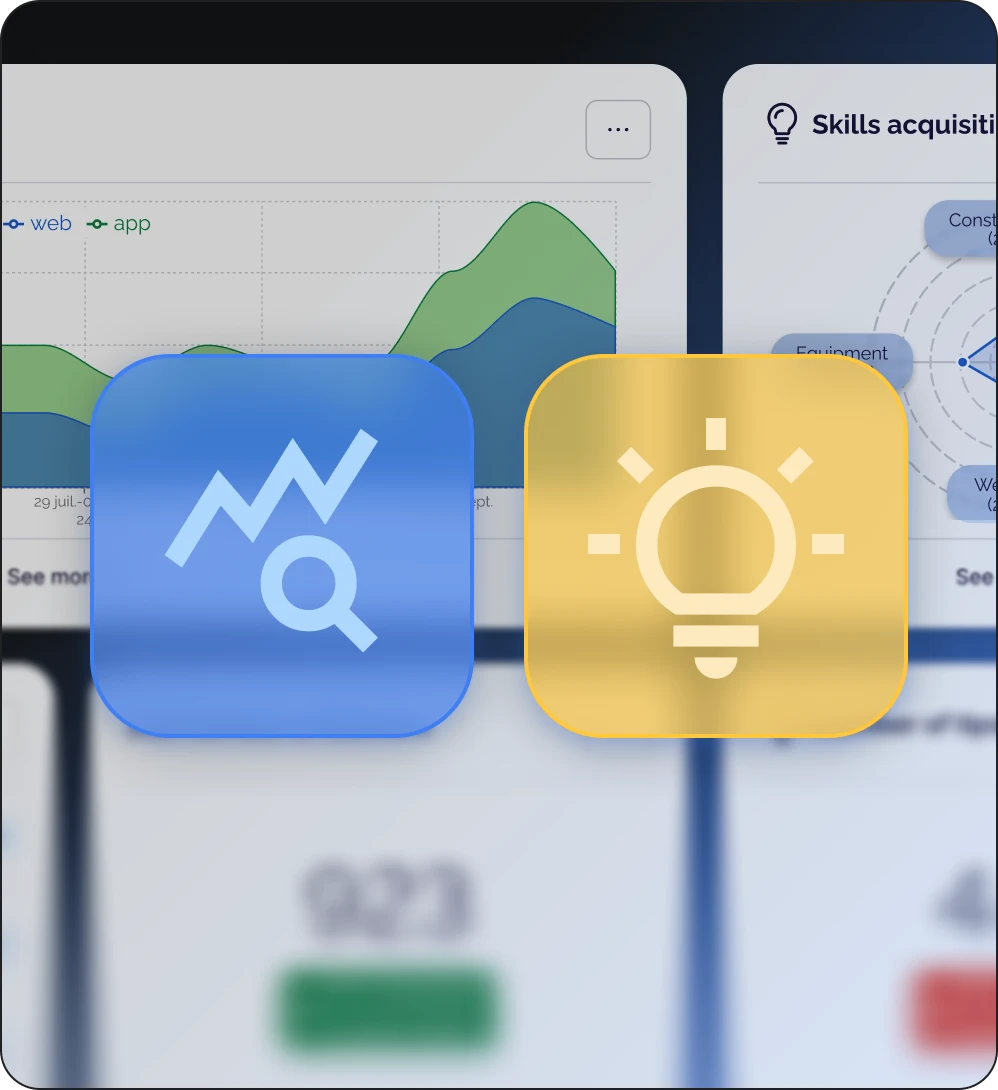
Social learning analytics
Measuring community dynamics and content creation
Tracking the authoring tool
Analysis of content creation and effectiveness
Mobile metrics
Understanding of uses in a mobility situation
Blended control
Comparative evaluation of different learning modalities
Connecting to your data ecosystem
BI integration
Connectors with your decision-making tools (Tableau, Power BI...)
Open APIs
Possibility to extract data for external analyses
They transformed their training management


Frequently asked questions
What skills are necessary for maximizing the use of analytics?
No special technical expertise is required. Our interface has been designed to be accessible to all training professionals and is intuitive to use. For more advanced analyses, our team will help you create your first personalized dashboards.
How can I demonstrate my courses' business impact?
Our platform correlates training indicators (completion, scores, and engagement) with your business KPIs. This allows you to establish links between training programs and improvements in field performance in terms of quality, productivity, and business results.